Climate Graphs
 Following on from my weather forecasting pages, I managed to get Noel Jenkins to vaguely inspire me again, although in this case it seems to have been a blog post from 2007 that did the trick. Nothing like delayed inspiration then...
I'm starting with some Climate Graph drawing skills, but this might go off in a few other directions at some point.
Climate Graphs in Excel
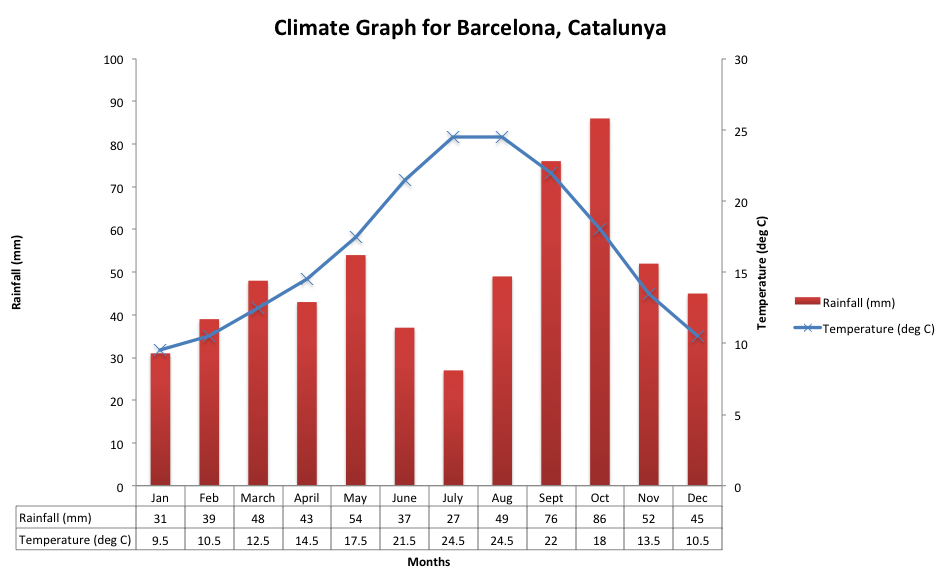
The instructions show you how to draw a climate graph in Excel. There are three sets of instructions, depending on which version of Excel you have. Use the spreadsheet provided as a starter so that you know how to do it!
![]() Climate Graph Drawing Instructions - Excel 2019 - the most up to date version of Excel. You will need to use the desktop app, not the online version
Climate Graph Drawing Instructions - Excel 2019 - the most up to date version of Excel. You will need to use the desktop app, not the online version
![]() Climate Graph Drawing Instructions - Excel 2016
Climate Graph Drawing Instructions - Excel 2016
![]() Climate Graph Drawing Instructions - Excel 2007, 2010 and 2011 (Mac version)
Climate Graph Drawing Instructions - Excel 2007, 2010 and 2011 (Mac version)
If you want a smooth line rather than a jagged line for your temperature data, then see the note at the bottom of page 3 of the PDF
These should work fine, but if you have any problems contact me and I'll see if I can solve them.
I've also worked up a tweaked set of instructions to apply this basic method to flood hydrographs.
Here's an example of the sort of thing you can produce.