
Hydrographs
Having sorted out creating climate graphs in Excel, drawing flood hydrographs seemed the logical next step. The theory's the same: two data sets on two axes on the same graph so this wasn't a long job.
The bigger problem seems to be finding data to draw a reasonably accurate and reliable hydrograph from. If anyone can help out with better data please let me know.
Hydrographs in Excel
The instructions will talk you through producing a hydrograph in Excel. There are three sets of instructions, depending on which version of Excel you have. Use the spreadsheet provided as a starter so that you know how to do it!
![]() Hydrograph Drawing Instructions - Excel 2019 - the most up to date version of Excel. You will need to use the desktop app, not the online version
Hydrograph Drawing Instructions - Excel 2019 - the most up to date version of Excel. You will need to use the desktop app, not the online version
![]() Hydrograph Drawing Instructions - Excel 2016
Hydrograph Drawing Instructions - Excel 2016
![]() Hydrograph Drawing Instructions - Excel 2007, 2010 and 2011 (Mac version)
Hydrograph Drawing Instructions - Excel 2007, 2010 and 2011 (Mac version)
The datasheet is one that seems to have been passed around a number of places. I can't work out where the original data came from - my gut feeling is that it's been simplified a touch. If it's your work please get in touch and I'll add whatever credits you want.
If you have problems downloading the spreadsheet please let me know. There have been difficulties experienced downloading similar sheets from this site and I'm keen to try and find a solution.
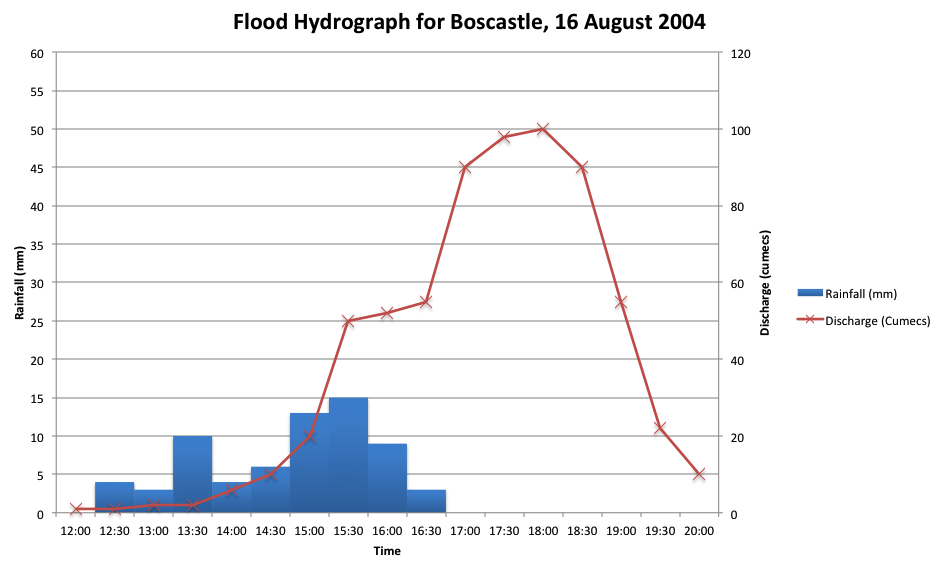
Here's an example of the sort of thing you can produce.
More on Boscastle
The 2004 Boscastle flash flood event is a pretty reasonable GCSE or A Level flash flood case study. There are loads of places on the web where information can be found, from the obvious Wikipedia article![]() (rather in need of references) to contemporary BBC news articles
(rather in need of references) to contemporary BBC news articles![]() .
.
The Met Office Case Study page![]() is well worth a look, especially for a GCSE case study.
is well worth a look, especially for a GCSE case study.